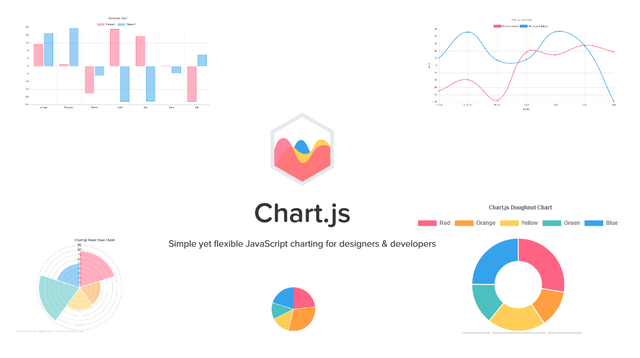
Chart.js
Chart.js is a free open-source JavaScript library for data visualization, which supports 8 chart types: bar, line, area, pie (doughnut), bubble, radar, polar, and scatter. Created by London-based web developer Nick Downie in 2013, now it is maintained by the community and is the second most popular JS charting library on GitHub by the number of stars after D3.js, considered significantly easier to use though less customizable than the latter. Chart.js renders in HTML5 canvas and is widely covered as one of the best data visualization libraries. It is available under the MIT license.
Installing Chart.js
Chart.js is easy to learn and easy to Install. To install Chart.js we just need put this script to header of our site.
<script src="https://cdnjs.cloudflare.com/ajax/libs/Chart.js/2.1.4/Chart.min.js"></script>
After that we need the place to our Chart. We use <canvas> tag for the place our Chart. Our Chart will display in that tag. <canvas>tag is recommended tag from Chart.js to shown the Chart. We must put our <canvas> Tag in our <body> Tag. Let’s look what we can do with Chart.js.
Canvas
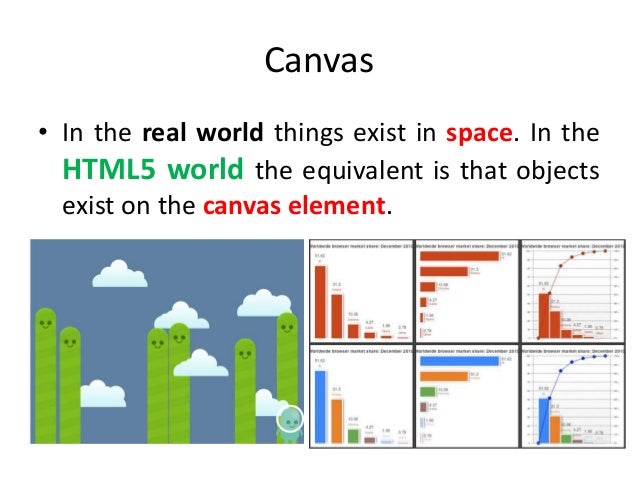
Basic usage of canvas
The <canvas> element
<canvas id="tutorial" width="150" height="150"></canvas>
Copy to Clipboard
At first sight a <canvas> looks like the <img> element, with the only clear difference being that it doesn’t have the src and alt attributes. Indeed, the <canvas> element has only two attributes, width and height. These are both optional and can also be set using DOM properties. When no width and height attributes are specified, the canvas will initially be 300 pixels wide and 150 pixels high. The element can be sized arbitrarily by CSS, but during rendering the image is scaled to fit its layout size: if the CSS sizing doesn’t respect the ratio of the initial canvas, it will appear distorted.
Drawing shapes with canvas
Now that we have set up our canvas environment, we can get into the details of how to draw on the canvas. By the end of this article, you will have learned how to draw rectangles, triangles, lines, arcs and curves, providing familiarity with some of the basic shapes. Working with paths is essential when drawing objects onto the canvas and we will see how that can be done.
The grid
Before we can start drawing, we need to talk about the canvas grid or coordinate space. Our HTML skeleton from the previous page had a canvas element 150 pixels wide and 150 pixels high.

Normally 1 unit in the grid corresponds to 1 pixel on the canvas. The origin of this grid is positioned in the top left corner at coordinate (0,0). All elements are placed relative to this origin. So the position of the top left corner of the blue square becomes x pixels from the left and y pixels from the top, at coordinate (x,y). Later in this tutorial we’ll see how we can translate the origin to a different position, rotate the grid and even scale it, but for now we’ll stick to the default.
Applying styles and colors
In the chapter about drawing shapes, we used only the default line and fill styles. Here we will explore the canvas options we have at our disposal to make our drawings a little more attractive. You will learn how to add different colors, line styles, gradients, patterns and shadows to your drawings.
Colors
Up until now we have only seen methods of the drawing context. If we want to apply colors to a shape, there are two important properties we can use: fillStyle and strokeStyle.
fillStyle = color
Sets the style used when filling shapes.
strokeStyle = color
Sets the style for shapes’ outlines.
color is a string representing a CSS <color>, a gradient object, or a pattern object. We’ll look at gradient and pattern objects later. By default, the stroke and fill color are set to black (CSS color value #000000).
Drawing text
The canvas rendering context provides two methods to render text:
fillText(text, x, y [, maxWidth])
Fills a given text at the given (x,y) position. Optionally with a maximum width to draw.
strokeText(text, x, y [, maxWidth])
Strokes a given text at the given (x,y) position. Optionally with a maximum width to draw.